Statistical sampling plans have been the backbone of food manufacturing QA for decades, and for good reason: they're grounded in probability theory, they're codified in standards most QA managers already know (ANSI/ASQ Z1.4 and Z1.9 are the common references in the US), and they let a small QA team cover a large production volume without inspecting everything.
The case for 100% inspection — specifically camera-based 100% inspection — isn't that sampling is wrong. It's that sampling's statistical guarantees only hold under conditions that food production lines frequently violate. Understanding where those violations occur is what determines whether 100% inspection is justified for a given application.
What Sampling Plans Actually Guarantee
AQL (Acceptable Quality Level) sampling, as defined in ANSI/ASQ Z1.4, works like this: for a given lot size, inspection level, and AQL target, the plan specifies how many units to sample and how many defects in that sample trigger lot rejection. The plan is designed to have a known probability of accepting a lot at the stated AQL defect rate.
At AQL 1.0 with inspection level II on a lot size of 1,200 units, the plan calls for a sample of 125 units with an accept/reject criterion of 3/4 (accept the lot if you find 3 or fewer defects in your sample; reject if you find 4 or more). That sounds rigorous. Here's what it actually means statistically: if the true defect rate of the lot is 1%, the plan will accept the lot roughly 90% of the time. If the true defect rate is 3%, it will still accept the lot roughly 50% of the time. Sampling plans are not guarantees of outgoing quality — they're probability management tools with defined operating characteristic curves.
This is not a criticism of AQL; it's just what the math says. The guarantee is only as strong as your confidence in the statistical model's assumptions.
Where Sampling Plans Break Down in Food Production
The core assumption of standard sampling plans is that defects are distributed randomly throughout the lot. Pull 125 units from a 1,200-unit lot, and under random distribution, your sample is representative. If defects cluster — which they do in food production — the representativeness assumption fails.
Consider label defects caused by a label applicator that drifts during a shift. The defect is not randomly distributed; it increases monotonically as the applicator wears until a maintenance intervention resets it. If your sampling interval is every 20 minutes, and the applicator drift cycle is 35 minutes, you'll systematically undersample the period of worst defect density at the end of each cycle.
The same pattern holds for heat seal failures caused by sealer temperature excursion, date code failures caused by inkjet head clogging, and contamination events caused by a piece of packaging material that breaks loose and affects a contiguous run of units. These are not random defects. They're process failures with duration, and duration-based defects have predictably bad outcomes under random sampling designs.
The Inspector Attention Problem
There's a second failure mode in manual sampling that doesn't get much attention in QA textbooks: inspector fatigue and attention drift.
At 600 units per minute with a 1-in-50 sample rate, an inspector is handling 12 units per minute — roughly 5 seconds per unit. Over an 8-hour shift, that's approximately 5,760 units inspected. Vision research on sustained attention tasks documents that human inspection accuracy declines measurably after 20–30 minutes of continuous inspection work. Repeat this across a shift, and your effective sample inspection quality by hour 6 is materially different from hour 1, even if the sampling rate is constant.
We're not saying human inspectors are bad at their jobs. We're saying that sustained visual inspection at high throughput is a task that humans are not well-designed to perform consistently for 8 hours, and QA plans that don't account for that degradation are accepting more risk than the stated AQL suggests.
The Case for 100% Inspection: When the Math Flips
For applications where defects cluster, where the cost per defect reaching a customer is high, or where the inspection problem is one of high-speed detection that can be automated, the economics of 100% inspection improve substantially over sampling.
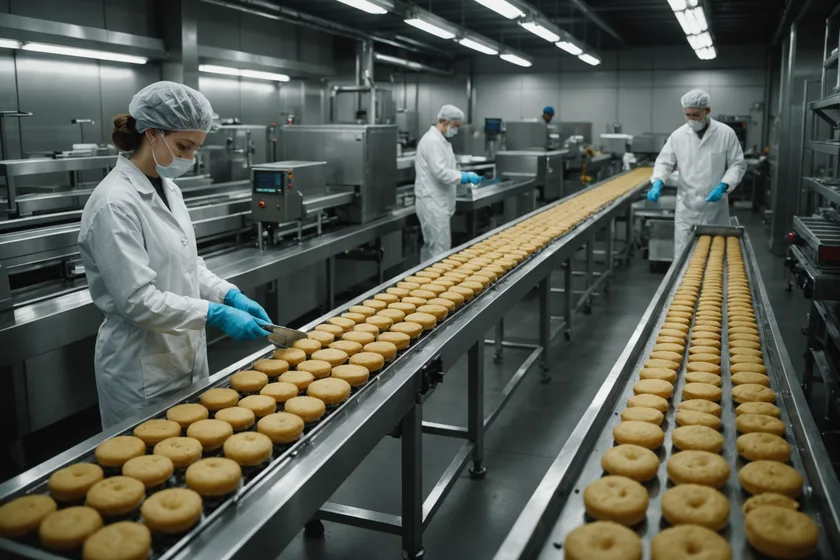
Start with the cost side. A camera-based inline inspection system at Foodtrce's Production tier costs $1,790/month per line. An inline vision system running at 600 units per minute for two 10-hour shifts inspects approximately 720,000 units per day. The per-unit inspection cost is $0.000083 — less than a tenth of a cent per unit. The marginal cost per additional unit inspected is essentially zero once the system is installed.
Compare that to manual inspection. A dedicated inline inspector at a fully-loaded labor cost of $22/hour inspects 12 units per minute on a sampling basis. The per-unit cost for sampled units is $22/(60×12) = $0.031 per sampled unit, but you're only sampling 2% of production, so the per-unit cost across all production is $0.031 × 0.02 = $0.00062. Manual sampling is cheaper per-unit — but it's covering 2% of units, not 100%.
The economic question isn't which approach costs less per unit. It's: what is the expected cost of the defects that escape through sampling versus 100% inspection, and how does that compare to the technology cost?
Running the Expected Value Calculation
Take a specific scenario: a snack food line running 400 units per minute with a defect rate of 0.8% (a realistic baseline for a well-run line with some process variability). Over a 10-hour shift, that's 240,000 units with approximately 1,920 defects.
Under AQL 1.0 sampling, inspecting roughly 125 units per lot (let's assume 2 lots per shift, so 250 units inspected): the plan has approximately a 40-50% probability of accepting each lot even at 0.8% defect rate. In the lots that are accepted with defects, virtually all 1,920 defects ship.
Under 100% vision inspection at a 94% detection rate and 0.3% false reject rate: approximately 1,805 of the 1,920 real defects are caught and rejected. Approximately 115 defect units slip through. Additionally, approximately 720 good units are false-rejected (0.3% of 240,000). The 720 false rejects are a real cost — those are good units in the waste bin — but they're a predictable, manageable cost that can be reduced through threshold tuning and per-SKU profiles.
The decision calculus comes down to: what is the cost of shipping 115 defects versus 1,920 defects? If a defect reaching a retailer triggers a chargeback of $15–$30 per unit (typical retail chargeback structures for visual packaging defects), the difference between 115 and 1,920 defects is roughly $27,000 per shift in avoided chargebacks — at a technology cost of roughly $60/shift for the Production tier subscription.
Sampling Still Has a Place
None of this means sampling-based QA has no role. Destructive testing — pull tests on seals, fill weight verification requiring the package to be opened, microbiology testing — cannot be done on 100% of production by definition. Sampling is the right tool for those applications. Incoming raw material inspection, where you can't install an inline camera in your supplier's facility, is another appropriate sampling context.
The argument for 100% inline inspection is specifically about non-destructive visual inspection of outgoing finished goods on high-speed lines with known clustered defect patterns. In that specific context, sampling's statistical guarantees are weakest and 100% automated inspection offers the best combination of coverage and cost.
The goal isn't to eliminate sampling from a QA program. It's to apply each tool to the part of the problem where its assumptions actually hold.
Making the Transition
For QA teams moving from sampling to 100% vision inspection, the operational shift is real but manageable. The inspection system generates data that sampling never produced: every unit's inspection result, timestamped and linked to the production record. That data exposes process variability that was previously invisible. The first few weeks of operation typically reveal defect patterns — time-of-shift drift, SKU-specific issues, maintenance-linked events — that weren't visible from sample data alone.
That visibility is operationally useful beyond just catching defects. It gives maintenance teams specific, data-driven trigger points for intervention. It gives QA managers a documented inspection record that sampling simply doesn't provide. And it gives production managers the ability to make threshold decisions — how sensitive to be on label position versus seal geometry, for a given SKU and customer — based on actual defect distribution data rather than judgment.
The shift from sampling to 100% inspection isn't just about catching more defects. It's about replacing a statistical approximation of what's on your line with an actual answer.